

A manager tells a team to get 90% line coverage. After a few weeks, the team reports 94%. Then someone runs mutation testing on the code. Mutation testing puts small defects into the code and counts the defects that the tests find. The mutation score is a very modest 34%. The tests run most of the code, but they miss two thirds of the small defects.
The two values describe the same tests. The manager asked for coverage, and the team supplied coverage. I invented this example, but the pattern behind it is old.
Six years ago, I wrote an article (that I never published) about how to measure the productivity of software teams. This month I read it again, before a work session about engineering success metrics. Some parts are still correct. Some parts I now write differently. One large subject is not in the article, because it did not exist then.
The old article made two claims. First, a metric that you read in isolation gives a wrong picture. Second, people game a metric when rewards or penalties depend on it. To game a metric is to change its value and not change the work. Its one solution was a full view of the delivery lifecycle, with small and continuous improvements.
This post examines those claims again. It makes four arguments:
- There are many metrics. The difficult task is to select a small number of them. I now start with questions.
- Give each metric one use. Only outcome metrics get targets.
- Raise the floor only when the trend holds, not after one good week.
- Coding agents change which metrics you can trust.
It was always difficult to measure the productivity of software teams. Martin Fowler wrote that productivity cannot be measured. This post does not try to measure productivity as one number. It selects a few metrics that answer specific questions. Coding agents make a good approach more necessary, because they make activity cheap.
Most of this approach is not new. For many years, I have used the full view, the ratchet and the caution about targets. The questions, the checks and the points about coding agents came from my recent work. I have no outcome data for them yet.
What Is Still Correct
The primary observation is still correct. A metric gives useful information until a reward or a penalty depends on it. After that, people push the value. Then the value does not describe the work. The usual name for this effect is Goodhart’s law.
Robert Austin gives a full explanation in Measuring and Managing Performance in Organizations. He divides measurement into two types. Informational measurement gives information. Motivational measurement changes what people do. He shows that motivational measurement works only when the measures cover all the important parts of the work. When they do not, effort moves to the things that are counted. The things that are not counted get less effort.
In the old article, I wrote that rewards and penalties seldom work. Now I make the claim narrower. Targets are safer on outcomes, because an outcome metric comes closest to Austin’s condition. It includes most of the important things. Two examples are the delivery of the agreed scope and its acceptance by the users. Targets do not work well on proxies, such as coverage or velocity. They also do not work well on individuals.
Start With Questions
The old article recommended a full view. You collect metrics from the plan, development, build, test, deployment and production stages. Then you read them together. That recommendation prevents an incorrect diagnosis. For example, a team commits code quickly, but it also breaks the build quickly. A different team is slow because it waits for requirements.
But the recommendation did not help you to select metrics, and selection is the difficult part. There are many metrics. There are many frameworks, such as DORA, SPACE and Flow. Many tools report tens of metrics by default. It is easy to make a complete list. Attention and agreed definitions are in short supply.
Now I start with four questions. Each delivery team must answer them. The questions are the same for all teams. The metrics that answer them change with the context.
The Goal Question Metric approach from Victor Basili and his colleagues also starts with questions. In GQM, each organization writes its own questions from its goals. Here, the four questions are fixed for every team.
The table shows candidate metrics for two contexts. The first context is teams with software in production. The second context is a new product before its first release.
| Question | Teams with software in production | A new product before its first release |
|---|---|---|
| 1. Do we deliver the things that we planned? | Planned work compared with delivered work, for each release. Read it with user acceptance. | Delivered scope compared with the agreed scope list. Read it with first-pass acceptance at showcases. |
| 2. Does quality stay stable? | Change fail rate. Escaped defects. Mutation score on changed code. | First-pass acceptance at showcases. Mutation score on changed code. |
| 3. Where does work wait? | Cycle time for each stage. Review queue depth. | Cycle time for each stage. Age of open questions. |
| 4. Can the team keep the pace and own the result? | Developer pulse survey. Engineers who did not write the code can explain it and change it. | Developer pulse survey. The engineers who get the code later can explain it and change it. |
The DORA metrics explain the difference between the two columns. Change lead time, deployment frequency, change fail rate and failed deployment recovery time all need production. A new product has no values for them before it goes live.
Also, the same metric name can have different meanings in the two columns. Deployment to a demo environment and deployment to production are different metrics. Do not compare teams from different contexts.
For each candidate metric, I do four checks:
- Which question does the metric answer?
- Who takes action when the value changes?
- Which other metric do you read with it? A good partner metric either does not move or moves in the wrong direction when people game the first metric. Andy Grove called these paired indicators in High Output Management. For example, mutation score is a good partner for code coverage.
- Which use does the metric have: outcome, improve or watch?
Most candidates fail check 2. Nobody acts differently when the value changes. Use one or two metrics for each question. A total of approximately eight keeps the list easy to read.
Check 3 applies to question 1 too. A team can deliver all of its plan by planning less. User acceptance shows when that happens. In fixed-scope client work, the agreed scope is the outcome that the client buys. The team cannot reduce it alone.
Expect to change the list as the team learns. The frameworks are most useful after the selection. Use them to make sure that the short list has no gaps.
The old article also told you to give equal attention to all parts of the lifecycle. I now remove that advice. Question 3 points your attention to the part where work waits.
Give Each Metric One Use
Check 4 asks which use a metric has. I divide the uses of a metric into three types. Each metric has one type.
| Use | Contents | How you use it |
|---|---|---|
| Outcomes | A small number of metrics for delivered and accepted work | Report them to management. Targets apply. |
| Improve | Two or three metrics for the current bottleneck | Use a ratchet. Each team starts from its own baseline. |
| Watch | The full view: plan, code, build, test and production | Read them together to find the bottleneck and to see when people game a metric. Set no targets on them. |
The full view from the old article is now the third row. It is a set of values to read. The short list of about eight holds the outcome and improve metrics. The full view is wider, and nobody reports it. Most of the metric problems that I know started in the same way. A watched metric got a target, and nobody made that decision on purpose. This is the two types of measurement from Austin, applied to one metric at a time.
The second row solves a different problem. Each team improves from its own baseline. Nobody needs to rank teams. People then have less reason to increase a value artificially.
Use the Trend for the Ratchet
Six years ago, I described ratcheting as five steps:
- Set the current level as the floor.
- Make a small improvement in a short time.
- Set the floor to the new level.
- If the level goes below the floor, stop the line until the level is correct again.
- Do steps 2 to 4 again.
Step 3 has a defect. One good week sets the floor too high. An unusual effort by the team has the same effect. The team cannot keep that level. Then normal variation starts step 4.
The correction is to read the trend. Move the floor only after the new level stays stable for three or more iterations in a row.
Donald Wheeler’s process behavior charts, from his book Understanding Variation, give a formal test for this. They separate a real change from normal variation.
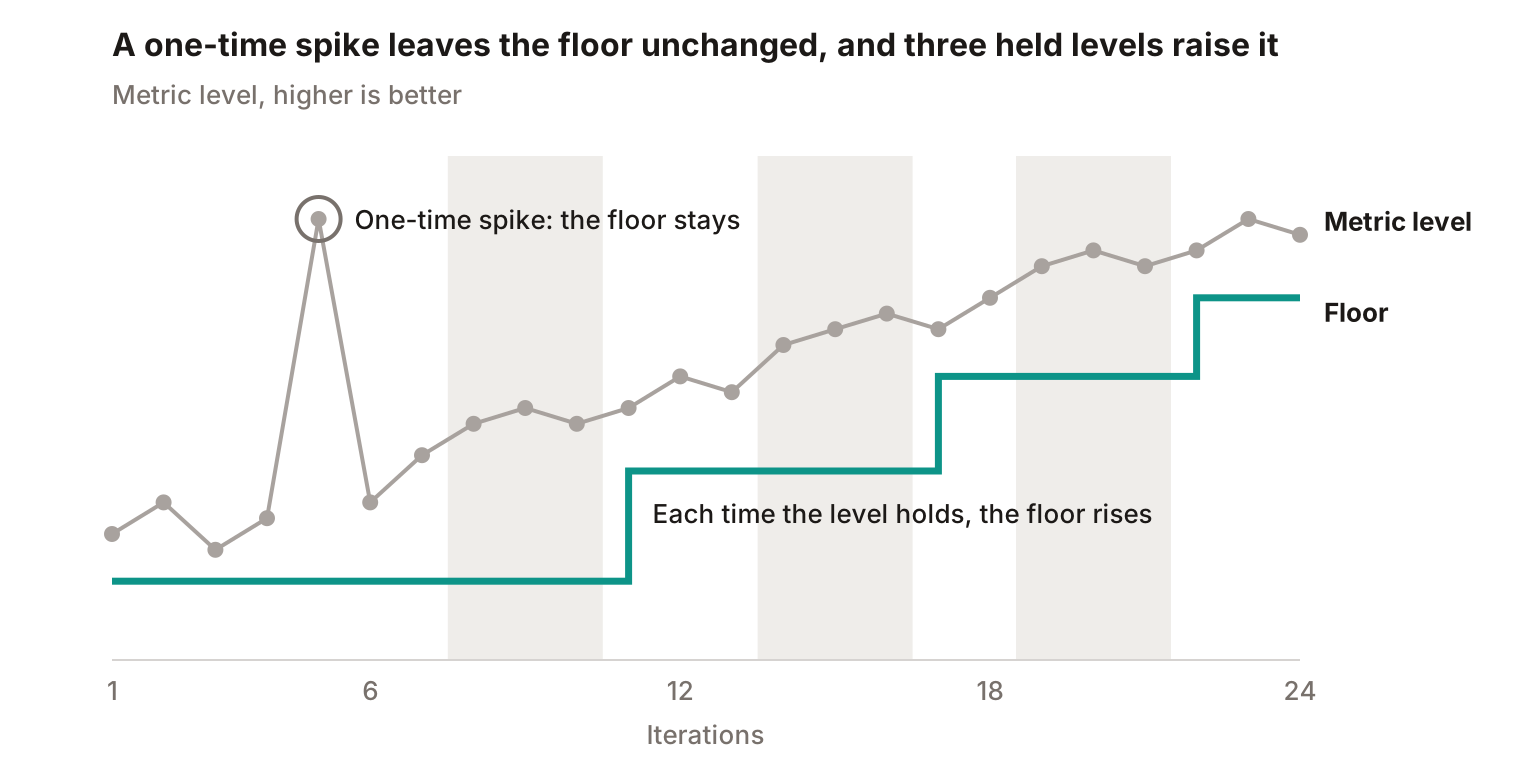
One spike does not move the floor. One dip is a value to understand before you stop the line.
So the corrected steps become:
- Set the current level as the floor.
- Make a small improvement in a short time.
- When the new level holds for three or more iterations, set the floor to that level.
- If the level goes below the floor, find the cause first. Stop the line only if the dip is more than normal variation.
- Do steps 2 to 4 again.
There are two limits. First, a metric can become stable at a good level. Then its work is complete. Move the ratchet to the next bottleneck, and keep the floor of the old metric. The old metric then moves to Watch. Its floor starts a team conversation. It never starts a reward or a penalty. Second, a trend needs history. The first floors of a new team are temporary.
What Coding Agents Change
Before the rise of coding agents, people wrote the code, the tests and the commit messages. Now coding agents write a large part of all three. This changes the argument in three ways.
Activity becomes cheap. A count of lines, commits or tests gave little information before. Now it gives even less, because an agent makes all of them at almost no cost. The coverage example above becomes the usual result. Tell an agent to increase coverage, and it increases coverage. The agent does not intend to mislead you.
The full view is less independent. The full view worked because different people made its sources. One developer wrote the change, its tests and the commit message. A different person wrote the acceptance criteria. Another person reviewed the change, and a tester checked it. Each one was a check on the others. Now agents also write acceptance criteria and review code. Then the same model can write the specification, the change and the check. More sources do not give you more independent checks. For how to keep the gates independent, see Engineer What Surrounds the Model.
The wait moves. Coding was already a small part of the week. Microsoft ran a survey of 484 of its developers. In that survey, coding was approximately 11% of the work week. Software.com collected telemetry from more than 250,000 developers. The median time for active coding was 52 minutes for each workday. That is also about 11% of an eight-hour day. Two different methods give almost the same number. If coding took no time at all, the rest of the work would still take about 89% of the week.
When coding becomes faster, the queue moves to review, test and decisions. On one of my projects, a feature took a day to build and then sat in review for a week. I describe it in The Bottlenecks. The 2025 DORA report seems to agree with this. It says that AI amplifies the strengths and the weaknesses of an organization.
I now prefer metrics that check the work against a source that the author of the change did not write:
- Mutation score, which is a test of the tests
- Acceptance by the users of the software
- Change fail rate, after production starts
- The ability of the engineers to explain and change the delivered code
An agent can also increase a mutation score. But it can do this only if it writes tests that find defects. That is the behavior that the metric must cause.
There is one exception. An agent can also change the measurement itself. It can exclude a file from coverage, disable a test, skip a mutator or lower a threshold. The measurement configuration is a source that the author of the change must not write. Protect it with code owners, and treat each change to it as a signal to investigate.
The last metric in the list is most important when ownership moves. This occurs when one team builds the software and a different team operates it.
What I Do Not Know
Three things limit my claims.
First, I have no outcome data for the recent parts. These are the four questions, the four checks and the metrics for coding agents. I have not used them long enough to report results.
Second, the data about AI and productivity continues to change. In 2025, METR ran a randomized trial. Experienced open-source developers were 19% slower with AI tools in that trial. They had expected AI to make them around 25% faster. In February 2026, METR gave an update. It said that the newer data probably shows a speedup. It also said that selection effects make the estimate unreliable, and that it will change the study design.
So I do not give productivity percentages. I am also careful with a metric that depends on such a percentage.
Third, I do not have a good method to check that engineers can explain the delivered code. A bad method becomes an assessment of individuals. I listed that above as a candidate not to use.
One method that I want to try is a handover test. During the handover, the receiving team makes a small change without help from the builders. The metric is the time that the team needs for that first change. It measures the team, not one person.
I keep four things from this work:
- Start with the questions that a team must answer.
- Give each metric one use. Only outcome metrics get targets.
- Move the floor only after a level stays stable.
- Prefer metrics that the author of a change did not write.
Try this. Open your own dashboard. For each metric, name the person who acts when it moves. Remove the metrics with no name. Which metric did you remove first? I want to hear why it was there.
The 2020 Article
This is the article as I wrote it in 2020. I changed only the formatting and fixed a few typos. I do not have the rights to publish three of the original images. I replaced two of them with new illustrations and left out the third. I also updated or removed links that no longer work.

Preamble
In a lot of ways, measuring the productivity of software teams feels like the pursuit of the proverbial holy grail! Like in the case of the mysterious and elusive mythological relic, many have claimed to have cracked it. And just like in the case of the holy grail, it is almost impossible to separate fact from fiction! So much so, that industry luminaries like Martin Fowler have famously proclaimed that productivity cannot be measured. Not that such proclamations have stopped anyone from continuing to try anyway!
A Productivity Primer
One of the definitions of the word productivity that I like, comes from the website businessdictionary.com and it reads:
“A measure of the efficiency of a person, machine, factory, system, etc., in converting inputs into useful outputs”.
From the definition above, in order to measure the productivity of a software team, one needs to first measure the amount of output produced (software in this case). Let’s ignore the qualifier “useful” that precedes the word outputs for a minute and assume that all work is equally valuable. It follows then, that teams producing more software with everything else remaining the same, are more productive! So what constitutes more software and how does one go about measuring it?
In this alchemical pursuit to measure software outputs and productivity, many a team (more their managers and stakeholders I daresay) have tried using a variety of measures ranging from the simple like Source Lines of Code (SLoC), Function Point Analysis (FPA), test code coverage, story points, team velocity, sprint burndown, bug counts to the arguably unconventional and exotic like code churn, recidivism, happiness metrics and many more.
What’s Going Wrong?
Most will likely agree that there isn’t much wrong with the metrics above themselves. Each provides a certain amount of information about a certain aspect of a software team. With today’s toolset maturity, it is relatively straightforward to obtain the numbers associated with these metrics as well. Furthermore, most if not all of these are fairly easy to communicate and reason about. In theory, each of the metrics above should be able to act as a rough indicator of team productivity. In reality though, they leave a lot to be desired to the extent that any attempts to measure productivity this way continue to meet with mixed results. This notion of not being able to meaningfully pull this off has become so prevalent that it is almost obligatory to not have any conversation on software team productivity without the adjoining cartoon being referenced!
Isolated Metrics
Producing complex, valuable software involves quite a bit of hard work. It requires all facets of the engineering organization to come together for magic to happen. Using a small subset of information obtained from a particular area of the organization, while not focusing on information from other parts, or entirely ignoring them, can result in mixed results, or worse still, in drawing the wrong conclusions. The maxim of half knowledge being dangerous definitely holds in this case!
So, developers on the team checking in code at a rapid rate may simply be causing breaking builds at a much more rapid rate or because they don’t think of enough scenarios to unit test, thereby producing low quality software. Or on the flip side, a team of developers checking in code very infrequently, may be held up because there isn’t a steady stream of well elaborated requirements or because the architects cannot agree on a solution quickly enough.
Information Silos and Excessive Hand-offs
Despite all our noble intentions to look at information at hand in a more holistic manner, prevailing organizational and team structures can sometimes get in the way of getting the right metrics and a more complete picture. This may make it much harder to do the right thing - demotivating otherwise well intentioned people to settle for sub-optimal solutions. Assessing the performance of teams that aren’t aligned to meet business requirements in the first place, can be very challenging, if not impossible.
While an engineering manager may be able to see that one of his teams is slow in adding new features, they may not be able to access information buried in the project tracking system that would have shone light on the fact that the requirements were not clarified to the desired level of granularity. This can result in a variety of problems such as duplication of effort, delays, loss of context and missed opportunities.
Carrot and Stick
Humans are innately emotional, psychological creatures who will go to any lengths towards the pursuit of excellence - and if that is too hard or in the worst case, impossible to attain, at least create a perception thereof. When the stakes are high and we are pushed to a corner, our natural reflex of wanting to defend our own interests instead of bigger, more noble goals kicks in really hard.
So a programmer whose productivity is being measured in lines of code will have the subconscious urge to write unnecessarily verbose code. Similarly, a Scrum Master/Iteration Manager may now be wrongly motivated to project inflated story points or velocity numbers to merely create an outward appearance of good team health. Or an entire team may now run after this quest for impossibly high code coverage numbers without any assertions - thereby adding low value tests. Not only does this set the wrong precedent for high performance, but can become downright dangerous. A team with artificially inflated code coverage numbers acquires this false sense of security about high code quality. Dan Pink examines the perils of using the carrot-and-stick approach at great length in his seminal book “Drive: The Surprising Truth About What Motivates Us”.
Where To Next?
So we get to the million dollar question then. If the metrics above are doomed to be misused, should we give up on our pursuit of trying to measure productivity? Can software team productivity really not be measured after all?
Take A Holistic View

Turns out, it may not be all doom and gloom here. Adopting an attitude of constant learning and improvement as opposed to one that looks to police and penalize can go a long way towards instituting a system that can be effective. Further, keeping in mind the need to look at a holistic picture, focusing more or less equally on all aspects of the delivery lifecycle as opposed to focusing on just a particular area can go a long way. If one is able to include information from planning, requirements intake, development, build, test, deploy, and feedback from running production systems, then one may be able to conclude reasonably that you have a high performing team.
Employ Ratcheting
Having recognized an improvement area, how does one go about setting oneself up for improvement? Setting clear, objective goals, measurable, trackable (no pun intended) for improvement is paramount to be able to subsequently meet them. In order to ensure that there is continuous incremental improvement, ratcheting is a technique that can be employed. A ratchet is a device that resembles a wrench, but is unique in that it turns in only one direction. In this context, ratcheting involves doing the following:
- Set the current level as the minimum starting point
- Make a small incremental improvement in a relatively small amount of time
- Re-adjust the baseline to the new level attained as part of step 2 above
- If levels descend below baseline, take stop-the-line action until baselines are restored
- Repeat from step 1
Ratcheting allows teams to set incremental milestones as intermediate goals while moving closer to a much better place all the time.
Which Metrics Then?
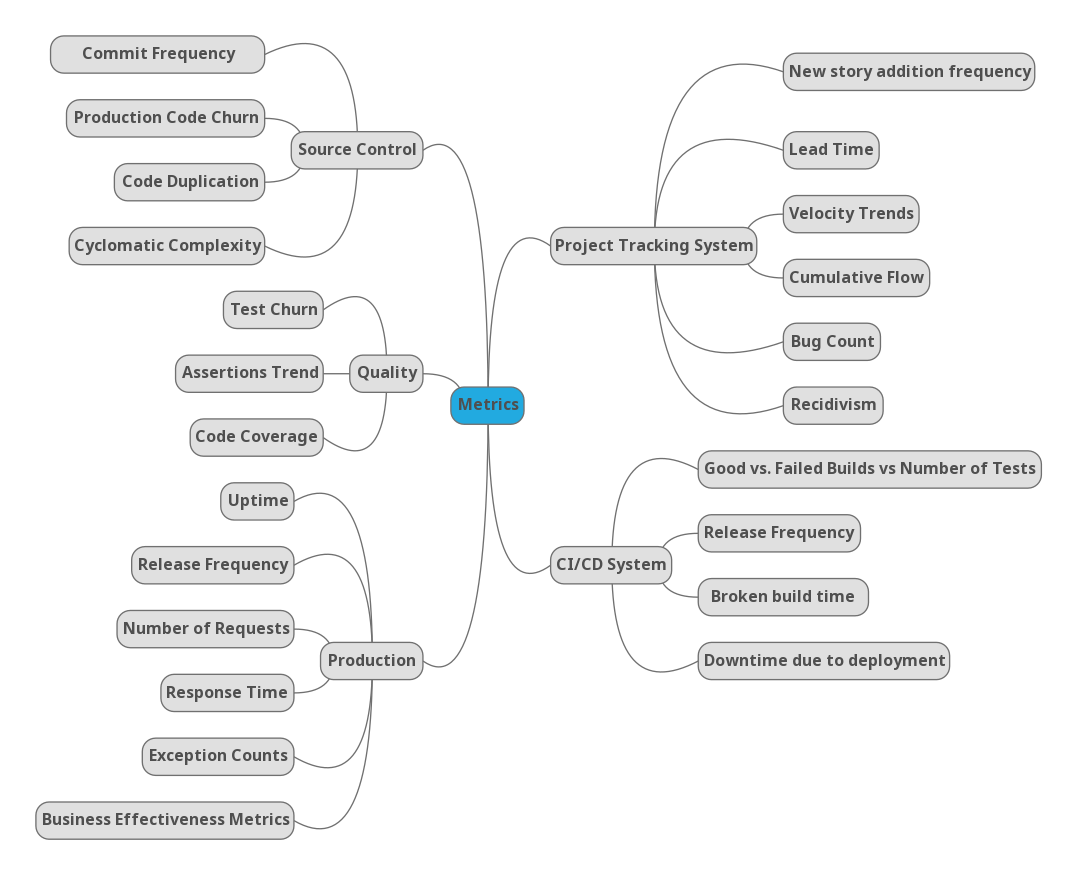
There is no dearth of metrics that one can pick from, when trying to look for improvement areas. However, as mentioned above, one will be best served picking a small assortment of metrics that cover the breadth of the software development cycle. Ideally, you will be able to see these metrics aggregated and visualized in a single dashboard. Tools like Hygieia can help with this. Included below is a suggested list (your own list of such metrics may be different depending on your specific situation) for your consideration.
Conclusion
Measuring software team productivity can be a bit of a wild goose chase with diminishing returns when the focus is on a small subset of metrics, restricted to a specific area of the delivery lifecycle. Establishing an environment that enables continuous incremental improvements, while taking a holistic view of the development lifecycle with the aid of aggregating tools that collate information from various data sources is likely to yield more comprehensive benefits.